
“ I believe in analysis and not forecasting. ” -by Nicolas Darvas
As rightly said by Nicolas Darvas, the above quote signifies the importance of analysis and different tools of analysis in the markets.
A simple and really efficient rule to be profitable in the market and which the retail traders generally tend to forget is to always be focused on your analysis and your system. A trade without analysis is equivalent to gambling in the markets and with the increasing number of traders in the markets, the markets are getting more cruel and punishing than before. So, a trader should always abide by his analysis and believe in it for his trades.
So, here we try to bring out a tool to aid you on the analysis front and help you gain better knowledge of the markets.
This module is written to explain the new feature added in the library which is Market Profile and was written during the winters of 2020 while I was interning at Symphony Fintech Ltd.
As the technology progresses and we get new and new technical analysis tools which are really complex and sophisticated, let’s not forget our building blocks and the old established techniques which have sustained themselves in the market and proved out to be useful the entire time.
One of such techniques is known as Market Profile which provides high insight into the market and forces the trader to completely understand how the market state is.
So, first things first, Let’s discuss what the market profile is and how it is useful for someone who is an Intraday trader and relies on the full thorough study of the market rather than just depending on his luck.
Market profile is a financial analysis technique developed by J. Peter Steidlmayer in the 60s. The technique represents the statistical distribution of a given market in a given period.
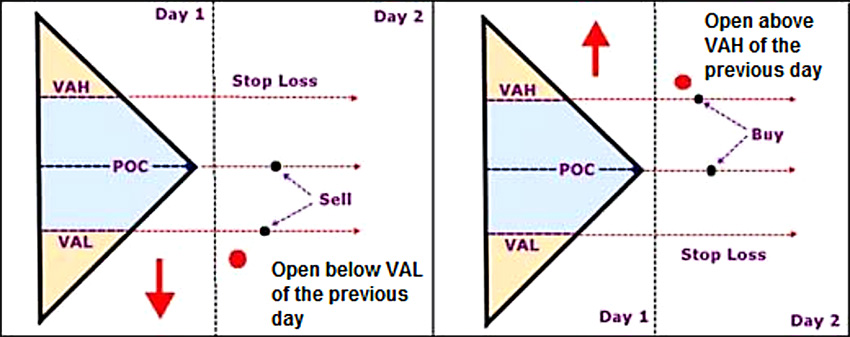
Market Profile uses time and price to locate the value areas of the trading session (i.e. price areas where the participants consider that the fair price of a given asset/instrument is located).
While it can not be used as a complete method or trading system to enter your position at markets but what it can be used as is a sound way to analyse the current status of a market as it helps the person to evaluate if the market is consolidating or trending.
One can perceive the Market Profile of a certain day as the combined overview of how much action happens at different prices the market trades.
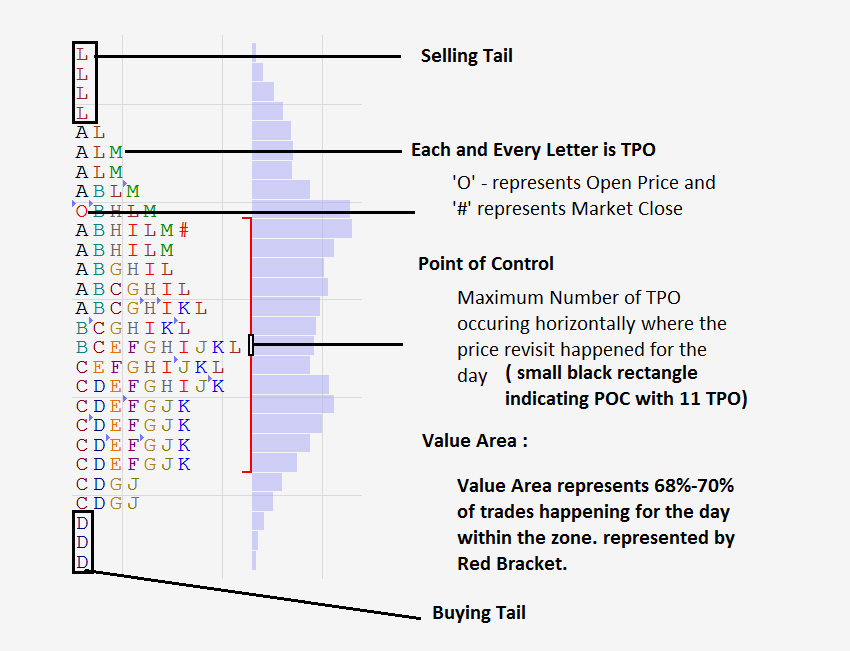
The Market Profile consists of 3 main terms :- Value Area, Point of Control, Time Price Opportunity(TPO).
These three basic components of Market Profile can be combined to form various types of deductions. More about market profile can be easily found over various websites and articles which can increase your insight into this field.
The code provided by us takes the input from the user and outputs the market profile accordingly which can be further used to integrate your strategies along with this.
So, now coming to the next step where you can finally implement and make use of this feature provided by the charting library of Symphony Fintech. This feature can be used in your already existing methods/strategies to strengthen your decision and filter out some losing trades.
The following steps will guide you through how to make use of this feature:
MarketProfile mp = new MarketProfile(priceHighList , priceLowList)
mp.Process(20);
mp.Print();
This prints the following output to the console depending on OHLC values (Here I am printing the Market Profile of 17th Dec BankNifty Futures):
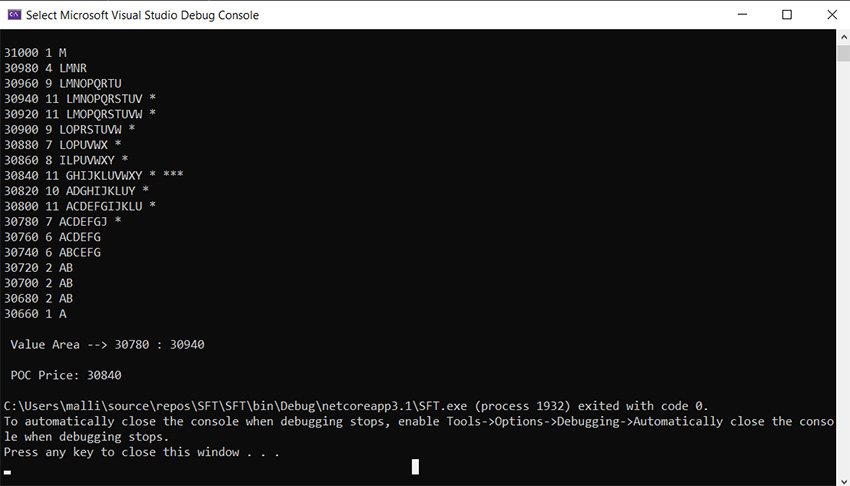
The single star(“ * ”) indicates the Value Area and the triple star(“ *** ”) indicates POC.
double VAL, VAH;
mp.GetValueArea(out VAL, out VAH);
double POC = mp.GetPOC();
The variables VAL and VAH correspond to the Value Area Low and Value Area High.
double[] Prices = mp.GetPrice();
int[] TPOCount = mp.GetTPOCount();
string[] TPO = mp.GetTPOString();
NOTE: After these commands, we have all the Prices that the market visits during the day in the Prices array in a descending order and their corresponding TPO Count and TPO String values in the same index as the price lies in Prices.
Eg. If the price 1200 lies at Prices[2] then it’s corresponding TPO count and TPO string can be accessed through TPOCount[2] and TPOString[2].
The above variables VAL, VAH and POC can be further used to add onto your analysis and confirm your trading calls with the concept of Market Profile.
As it’s a fact that getting an extra confirmation into your trading system doesn’t harm your decisions, the concept of market profile and various attributes related to it can be used for this extra bit of information and making your system more robust and fine. So, the above steps can be followed to get the information about the Market Profile and use it further.
 I am Paras Malli, third-year undergraduate student at Indian Institute of Technology, Kharagpur enrolled in it’s B.Tech 4 year course in the department of Electronics and Electrical Communications Engineering. I developed a keen interest in the stock markets and financial techniques and went on to study the various aspects of the markets. I started my work as an intern at Symphony Fintech Ltd. during winters of 2020 under Mr. Naveen Kumar, CTO Symphony Fintech Ltd. and worked on the features discussed in this blog.