
“Do not anticipate and move without market confirmation – being a little late in your trade is your insurance that you are right or wrong.” – by Jesse Livermore
This quote by famous trader, Mr. Jesse Livermore inculcates the sense of how important it is to have market confirmations which justify your positions in the market. This builds confidence and stability in your trading system.
Thus, to help the retail traders in the market confirmations, we bring out a new feature to the Charting Library known as Footprint chart which helps the trader to get the inside information of a candle in the chart.
This type of information can be really useful to the retail traders which have no access to the Tick-by-Tick data and hence, have no idea what happens inside a candle. From the last sentence, we want to refer to the fact that a retail trader doesn’t have insight into how much participants are involved at what level inside a candle. This method brings out this useful information and helps the trader to recognize the volume imbalances happening in real-time data.
Some key points before we delve deep into this module:
So, the using above terms, we can visualize the footprint chart as the figure depicted below:
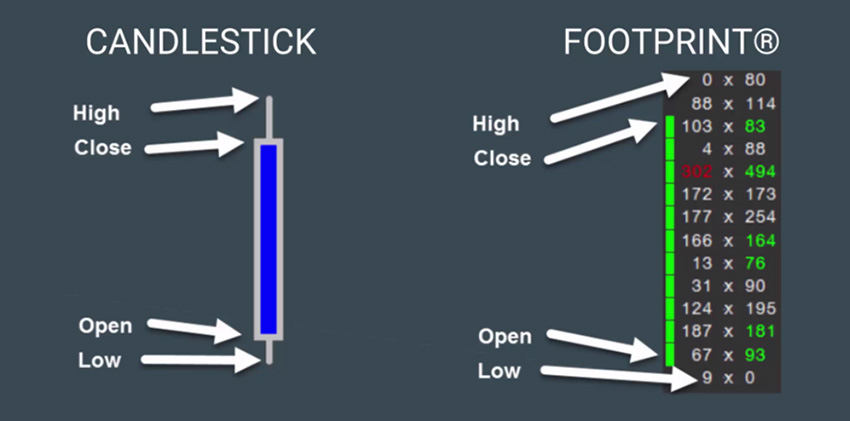
The Footprint chart you see on the right has the inside information of candle as we talked about earlier and the numbers in green signify Buy Imbalance and numbers in red a sell imbalance.
One of the terms, which have been coming up is the Imbalance parameter. So this is a defined parameter by the user which defines the amount of imbalance between the Sellers and Buyers the user wants to observe. A big imbalance parameter will cause the system to only pinpoint those areas where big supports/ resistances are present. Whereas, a smaller imbalance parameter can give us where the price is likely to move and if the imbalances sustain their direction or not.
So, this has been the basic overview of the Footprint chart and Volume Imbalance. You can search over the internet and get various systems/strategies from these charts.
Now, Let’s see how our library offers the use of this feature.
The data input to this class should be a Tick-by-Tick data to get the accurate results so that it can get the exact volumes being traded at different levels.
while ((fileLine = file.ReadLine()) != null){
     if (counter == 0){
          counter++;
          continue;
     }
     string[] Splitstring = fileLine.Split(',');
     string dtSec = Splitstring[0].Substring(0, 19);
     CultureInfo provider = CultureInfo.InvariantCulture;
     DateTime dt = DateTime.ParseExact(dtSec, "yyyy-MM-dd HH:mm:ss", provider);
     uint volumeTraded = uint.Parse(Splitstring[6]);
     double tradedPrice = double.Parse(Splitstring[10]);

     if (volumeTraded <= 0)
          continue;
     if (tradedPrice == prevLastTradedPrice)
          continue;
     prevLastTradedPrice = tradedPrice;
     lastTradedPriceList.Add(tradedPrice);
     volumeTradedToday.Add(volumeTraded);
     timeStampList.Add(dt);
}
In the above code, the file is the input file which contains a TBT data and further code extracts the data where the LTP changes. Also remember to initialize all the variables used in the code.
Using the code above, we have two important lists that we need to pass down to the VolumeImbalance class which are lastTradedPriceList and volumeTradedToday. After we have this new data, we can move towards creating a new instance of the class and further using it’s methods.
The class processes the data and creates the data for the footprint chart of the data provided and also filters out the buy and sell imbalances along with the magnitude of imbalances.
VolumeImbalance VI = new VolumeImbalance(lastTradedPriceList, volumeTradedToday);
VI.Process(1.4 , 20); //where 1.4 is an imbalance parameter and 20 is the range.
The process method has processed all the data provided into ranges and calculated the various imbalances and magnitude of them too. Now, to access the data we can use various method calls such as:
VI.Print();
The above call prints something similar to the console:(Here the data provided to the Volume Imbalance class is BankNifty Futures data for 17th Dec’20 for the first 15 mins):
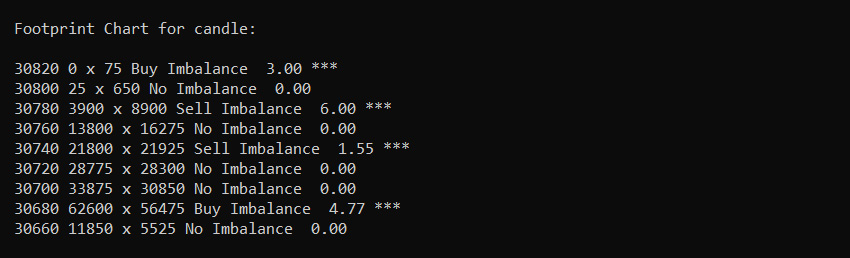
To efficiently use this class, this class can be used inside a loop and the VolumeImbalance class be called at every specified time period like 5,10,15 minutes or whatever time period the data has to be processed.
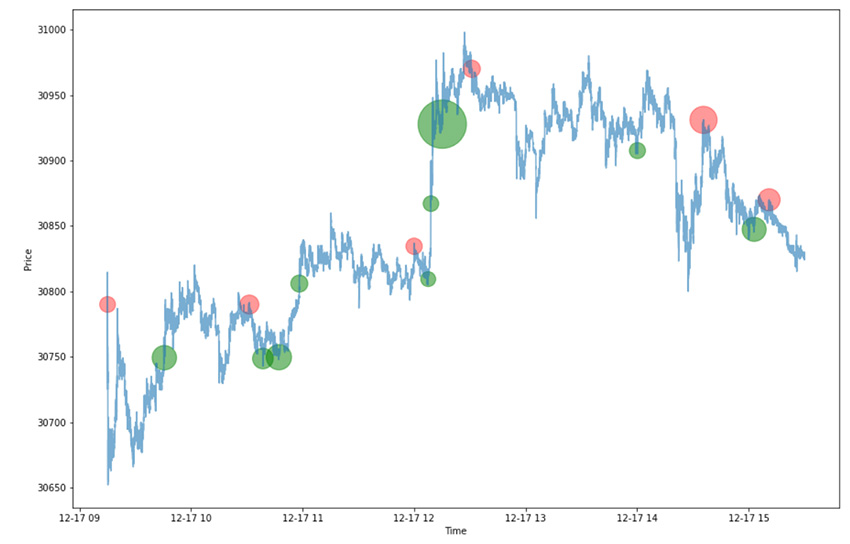
This class can be used in real time to identify big imbalances(Buy/ Sell) and hence able to identify big movements coming in the markets.
This class can also be used to observe if the psychological support/resistance levels decided by you act as support/resistance and also how strong the support or resistance level is by looking at the magnitude of imbalances.
 I am Paras Malli, third-year undergraduate student at Indian Institute of Technology, Kharagpur enrolled in it’s B.Tech 4 year course in the department of Electronics and Electrical Communications Engineering. I developed a keen interest in the stock markets and financial techniques and went on to study the various aspects of the markets. I started my work as an intern at Symphony Fintech Ltd. during winters of 2020 under Mr. Naveen Kumar, CTO Symphony Fintech Ltd. and worked on the features discussed in this blog.